Jump to content
  • Welcome!

    Register and log in easily with Twitter or Google accounts!

    Or simply create a new Huddle account. 

    Members receive fewer ads , access our dark theme, and the ability to join the discussion!


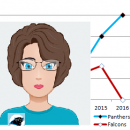
Panthers history in close games (including a re-post of a July 2016 article I wrote)


KB_fan

Recommended Posts

Will Bryan (aka Panthers stats guy) has an interesting article today about Panthers history in close games, with the key point being, Panthers have the best record in the league in close games since 2013.

https://www.panthers.com/news/panthers-are-among-the-league-s-best-in-close-games

Here's what Will tweeted about this:


That reminded me of some research I did on this topic following the 2015 season.  Back in the day, Jeremy allowed users to create their own blogs here, and I posted a detailed article on Panthers history in close wins.  (A shorter version of it was published as a lead article here:  http://www.carolinahuddle.com/2016/07/15/carolina-panthers-close-games/ )

The full version of my article / blog entry is no longer available here, but I thought it might be interesting to re-visit some of what I posted 2+ years later.  I'm going to try and re-post my full article here from the version saved on my computer.

***

“Riverboat Ron”- the legend grows. The Panthers Amazing Turnaround in Winning Close Games (July 2016)

The 2015 Season for the Panthers produced a lot of franchise bests.  One of the less discussed or less noticed stats was the Panthers success in winning close games.  It turns out that 2015 was a record year for the Panthers in that category as well.

In 2015, the Panthers had a franchise best +6 differential in close games.  In the Regular Season they played 8 games decided by less than 10 points, and won 7 of them. (7 wins / 1 loss = +6 differential).

Thanks to Sporting Charts, here’s a graph of the “small-win-loss differential” over the course of Panthers history 1995 - 2015:

1404013354_PanthersSmallW-Ldifferential1995-2015.png.b436f266959f365b7e087b5ac4f06e01.png


Data from Sporting Charts

Sporting Charts divides NFL wins & losses into 4 categories:

    • Big Win - a win in which the team won by 10 or more points.
    • Small Win - a win in which the team won by between 1 and 9 points.
    • Big Loss - a loss in which the team lost by 10 or more points.
    • Small Loss - a loss in which the team lost by between 1 and 9 points.

Here’s what Sporting Charts has to say about Big Win vs. Small Win differentials:

Quote


Teams that are able to consistently outscore opponents by significant margins should be considered to be very strong teams vs. teams that edge out wins by smaller margins. This strength is represented in the Big Win % statistics which measures the percentage of a team’s games that are won by 10 or more points.

Additionally, a statistic that can indicate a larger degree of luckiness or unluckiness is the Small Win-Loss Differential which compares the number of small wins to small losses. Wins and losses in the 9 or less point range can be thought of as more random than big wins and losses and therefore a team with a large differential (either positive or negative) can be a sign that the team got lucky or unlucky in close games - something that is unlikely to repeat and can be a sign of a team that could regress.


Of course lots of big wins makes for a great season, no denying it.  But I don’t think one should overlook the importance of small wins – i.e. pulling out a win in a close game.  I’m not so sure I agree with Sporting Charts’ suggestion that a strong small win differential is typically due to a team “getting lucky.”  My sense is that there’s very often a less tangible, but nonetheless CRITICAL, “will to win factor” in such games.  (Think again of Cam’s nodding his head on the sidelines as if to say “I got this” in the final minute of the Giants game after the Panthers had given up a large lead and the Giants had tied the score.)   Yes, the 2015 Panthers had quite a few “Cardiac Cats” moments. They gave up some leads they shouldn’t have.  In some cases one clutch play saved the game or led to the win. 

·         J-No’s end zone interception against the Saints;

·         Thomas Davis’ interception of Rodgers as the Packers were threatening in the final minutes. 

·         Luke’s interception against the Colts in OT which set up the Panthers’ game winning field goal. 

·         TD’s “hands team” catch of the onsides kick against Seattle in the Playoffs that preserved the win after the Panthers had given up 24 unanswered points.


But was that “luck?”  I contend these “clutch” plays happened too regularly throughout the Panthers season in 2015 for them to be mere luck.   The Panthers defense consistently forced turnovers and the offense capitalized on them.  Taken together they resulted in 17 wins:  9 “big” wins, 8 “small” wins – but those 8 “small” wins versus

·         Houston,

·         New Orleans (twice),

·         Seattle (twice including divisional playoff win),

·         Indy,

·         Green Bay,

·         Giants

were HUGE for the Panthers, and the key to the Panthers extraordinary season. 

I think Carolina’s experience with the small win differential also points to the critical role coaching plays during close games, because the evolution of Ron Rivera as a coach has been striking to witness.

Most Panthers fans know this story well.  In Ron Rivera’s first two seasons (2011 and 2012) and into the beginning of 2013, the Panthers struggled mightily to win close games.  The nadir was reached against Buffalo in week 2 of 2013 after Buffalo squeaked out a 1 point win on a field goal in the final seconds.  It was a heart-breaking loss for the Panthers, and the speculation began that Ron Rivera would be fired. 

On Sept 15, 2013, Sports headlines screamed:

“Carolina is 2-14 in games decided by 7 points or less under head coach Rivera”

By his own account, that loss to Buffalo prompted deep soul-searching and re-evaluation of his coaching decisions, particularly his attitude towards calculated risks.  Rivera began coaching more aggressively, playing more to win, rather than playing “not to lose,” and the persona Panthers fans now know and love, “Riverboat Ron” was born.

The results have been nothing short of amazing.  Since the birth of “Riverboat Ron” The Panthers record is 16-3 in games decided by a touchdown or less.  That kind of dramatic turnaround and consistent winning in clutch situations seems like a lot more than luck.

Let’s take a closer look.  Here are all the Panthers games decided by a touchdown or less since Ron Rivera became head coach in 2011:

657491541_CloseGames2011-2015.thumb.png.05103dd0bf7e3d058e1dd18cb91d2111.png

Including the Post-Season, from 2011 – 2015 the Panthers have played a total of 86 games.  Of those, 35 games (40.7%) were decided by one touchdown or less (7 points or less).   Here’s how it breaks down Pre-Riverboat Ron and Post-Riverboat Ron:

1377496536_Pre-PostRiverboat.png.75f7c38a8ffe5f9cb18f866cccd674d3.png


2-14 “Pre-Riverboat” (.125 win percentage)

16-3 “Post-Riverboat” (.842 win percentage)

Those results aren’t “luck.”  That kind of turn-around is due to attitude.  A will and a drive to win, grit, clutch play, and yes, skill too.  A great coach.   A great team.  A team making their own luck.  Long may this riverboat keep on rollin’.

***

P.S. for the true stat geeks, here’s a bit more evidence that success in winning close games is strongly correlated with overall success.  Thanks to Sporting Charts, I was able to import data for all teams’ small wins and losses for 2009 – 2015 into Excel.  (That represents 224 seasons of NFL football, i.e. 32 teams X 7 years). I looked closely at the top 50 teams over that 7 year period in terms of wins and losses in close games.   All 50 of these teams had close game win % of .667 or better.  Only 8 of these teams won fewer than 10 total games in that particular season.   The teams that won close games had winning seasons.

Grouping the data by average close win % and showing the average number of wins and winning % for each tier:

3354824_closegamewintotalwins.png.ea82789654f77495e07a3e896906a7d4.png


While the summary table above does not show the full data for number of close games played, one thing I find particularly interesting is that there is not a huge difference in the number of close games played between winning and losing teams.  The teams with the best close win % played 7 close games per season on average, 1 fewer close game per season than the teams with a worse close win %.  Good teams don’t merely rely on big wins when they dominate their opponents, but they find a way to win close games.  They make their own luck, just as Riverboat Ron and the Panthers have done since week 3 of 2013.

The 2003 Panthers – aka the Cardiac Cats – deserve a special mention in talking about close wins.  They played 13 close games and won 9 of them.  NFL success is not always about blow out wins.  Playing lots of close games, but winning almost all of them is also a recipe for success -- a rare one,  a heart-stressing one.  But it can be done.  It just takes guts.

The 2001 Panthers deserve a place in the close game hall of shame.  They played 9 games decided by fewer than 10 points, and lost them all.

Here’s a look at Panthers History in terms of close games played and close games won:

1490056684_Panthersclosegamehistory.png.4cc2fcda81b8b0033abbf3cb0fa1d06e.png


***

Forgive me for the indulgence of re-posting my old article here.  But I want to update some of this research in the coming days, so it's helpful to have this old analysis available online....


Link to comment
Share on other sites

18 minutes ago, KB_fan said:

In 2015, the Panthers had a franchise best +6 differential in close games.  In the Regular Season they played 8 games decided by less than 10 points, and won 7 of them. (7 wins / 1 loss = +6 differential).

The '72 Dolphins (17-0), won 6 games by 7 pts or less, including all three post season games, and another 3 by 10 pts. 

Link to comment
Share on other sites

23 minutes ago, KB_fan said:

2-14 “Pre-Riverboat” (.125 win percentage)

16-3 “Post-Riverboat” (.842 win percentage)

Those results aren’t “luck.”  That kind of turn-around is due to attitude.  A will and a drive to win, grit, clutch play, and yes, skill too.  A great coach.   A great team.  A team making their own luck.  Long may this riverboat keep on rollin’.

Huge reason Rivera is one of the best coaches in the league, thanks for posting this.

Link to comment
Share on other sites

2 minutes ago, t96 said:

Huge reason Rivera is one of the best coaches in the league, thanks for posting this.

You're welcome.  Those post-Riverboat stats are now a little bit less gaudy with our 2-6 record in close games in 2016 and our 3-2 start in close games this year. (But on the positive side, 8-2 in 2017).  I'll have the updated table / graphs later tonight or tomorrow, I hope.

Link to comment
Share on other sites

great post, thank you for compiling all this information.

do the stats indicate the number of comeback close wins vs the number of close wins in which the panthers had the lead initially - let's say, by more than 10 points?  i'm asking because i'd like to know if, in fact, it is due to playing to win instead of not to lose.  it seems that the offense tends to "take their foot off the gas" when up by 10.  i'm not questioning rivera's toughness and discipline, the players emulate this; i just want to know if the "playing not to lose" mindset is a fair critique - one that i make frequently.  i would like to know if i am incorrect in this assessment and, if so, i will discontinue its use.  at the end of the day, we all just want the team to win, no matter the way.  personally, i like blowouts and seeing the other team give up before the offense is reigned in, but i'm just a fan posting on a forum and not an NFL head coach.

thank you again for using your free time to compile all of this information for us, it is greatly appreciated.

Link to comment
Share on other sites

1 hour ago, billionairemonk said:

do the stats indicate the number of comeback close wins vs the number of close wins in which the panthers had the lead initially - let's say, by more than 10 points?

I'll see what I can compile on this over the weekend.

Link to comment
Share on other sites

I enjoyed reading this.

The big take-away IMO is that the NFL is a sports league that is structured to have parity and turnover at the top: The business is about generating national tv revenues which means all teams must have a decent chance to be competitive and win at all times in order to maintain broad national interest. This is unlike baseball which is structured to generate local tv revenues and ballpark attendance by not having salary caps which leads to a few teams always having the best chance to win.

The Patriots may be the greatest anomaly in pro sports history. They have had a two decade run as a premier team in a sports league that tries to force equal odds and results to all it’s member teams. Brady and Belichick have combined to create results that are statistically off the charts and will never be replicated - it’s one thing to have a dynasty for 5-7yr run but to approach 20yrs is stupefying.

Having said that, blowouts are not how the NFL is built to operate. Most games are within two scores and often inside 7pts so the difference in a typical NFL game often comes down to the execution of a few plays. Basically, the difference between a winning and losing franchise in the NFL is the results in one score games. This is why the NFL is exciting and frustrating for fans.

This year is no different. Casual fans of the Rams will notice the splash highlights and undefeated record of that team this year and believe them to be a juggenaught, but despite the ridiculously talented roster on all three sides of the roster, the Rams have had 7, 3 and 2 point wins in their last 4 games.

They have covered just 1 out of the last 4 games. They have covered only 6 out of the last 19 home games. In short, the Rams are actually underperforming greatly versus objective expectations. But what they are doing is figuring out how to win games which is not unlike what Carolina has done for the past 5 seasons.


Link to comment
Share on other sites

Archived

This topic is now archived and is closed to further replies.


×
×
  • Create New...