Jump to content
  • Welcome!

    Register and log in easily with Twitter or Google accounts!

    Or simply create a new Huddle account. 

    Members receive fewer ads , access our dark theme, and the ability to join the discussion!


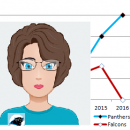
[NOT SO] Silly Statistics: Low Preseason Sacks Allowed = Regular Season Wins


KB_fan

Recommended Posts

Total offensive plays.

I pulled the data from the NFL.com stats page.

For the total plays, the data come from "Scrm plays" column of the team stats / offense / game stats table.  Example here, for the 2014 preseason:

http://www.nfl.com/stats/categorystats?archive=true&conference=null&role=TM&offensiveStatisticCategory=GAME_STATS&defensiveStatisticCategory=null&season=2014&seasonType=PRE&tabSeq=2&qualified=false&Submit=Go

For Sacks, the data come from the "sck" column of the team stats / offense / passing table.  Example here for 2014 preseason:

http://www.nfl.com/stats/categorystats?archive=true&conference=null&role=TM&offensiveStatisticCategory=TEAM_PASSING&defensiveStatisticCategory=null&season=2014&seasonType=PRE&tabSeq=2&qualified=false&Submit=Go

These tables are sortable so, for instance if you click on the sacks column, you can instantly sort from lowest to highest, which is how I came up with the ranking figures for each year.

For 2001 - 2005, the preseason data doesn't exist in table format that I could find.  For those years, I could find Panthers data by skimming the box score data for each of the Panthers preseason games in those years and totaling up the offensive plays & the sacks allowed.

e.g. 2001 preseason week 1 game data is here:

http://www.nfl.com/schedules/2001/PRE1

I'm hoping I'll be able to find box score / gamebook data for 1995 - 2000 Panthers preseason games, but it just may not be available online that far back...

Thanks!  Grrrr my cell is glitching.........already typed up my thoughts o well.  Thanks again KB!

Link to comment
Share on other sites

This is some really cool analysis @KB_fan and does have a fair amount of relevance. There was some  analysis a year back which showed the most accurate stat for correlating to wins was sacks performed/sacks taken. I'm trying to find the numbers but I'm pretty sure no Super Bowl winning team has ever had a negative ratio of sacks vs sacks taken.

Link to comment
Share on other sites

Question for any of you who followed the 2013 season closely.

I really was just a pretty casual Panthers fan in 2013.  I mean I was very excited about the team, but at that point I could still hardly name more than maybe 6 - 8 players on the roster, and I don't have a very strong recollection of the game by game evolution of the season in terms of injuries / roster changes etc. (I was traveling a lot during the season.)   I've really only become focused on studying the roster and Panthers stats since the 2014 season as my love for the Panthers has grown.

So, for those of you who followed the Panthers closely in 2013, what was going on with our OLine?  Were there injuries / player subsitutions that would have led to such an increase in sack percentage from the preseason to the regular season?  That 6.1 ratio of sacks in the regular season to sacks in the preseason in 2013 is just such an outlier, it seems odd...

Could it have been due to strength of schedule?  (I seem to recall we had the most difficult strength of schedule in 2013, am I remembering correctly?).

In my memory, 2013 was all about our D, and so while I can look up a summary of our O line players, etc., I won't have the same insight as those of you who lived and breathed the 2013 season as truly committed fans.  So, anything you can share that might give insight on why 2013 "breaks the mold" of the pattern we've seen shaping up here would be interesting to me.


Link to comment
Share on other sites

This is some really cool analysis @KB_fan and does have a fair amount of relevance. There was some  analysis a year back which showed the most accurate stat for correlating to wins was sacks performed/sacks taken. I'm trying to find the numbers but I'm pretty sure no Super Bowl winning team has ever had a negative ratio of sacks vs sacks taken.

Well, given that in 2013 we led the league with 60 sacks against our opponents... that makes our level of 43 sacks allowed in 2013 look not quite as bad!

Link to comment
Share on other sites

I've edited the thread title from Silly Statistics... to [Not So] Silly Statistics...

Really this began as kind of a lark as in... let's find one crazy statistic and claim that all Panthers wins can be explained by this....

And besides, I did want to give some love and a shout out to our OLine for their incredibly few sacks allowed in the preseason.

But obviously, this perhaps really is an interesting statistic to analyze to see how it correlates to team success... so let us stat geeks all unite and let the number crunching continue!

Link to comment
Share on other sites

This is some really cool analysis @KB_fan and does have a fair amount of relevance. There was some  analysis a year back which showed the most accurate stat for correlating to wins was sacks performed/sacks taken. I'm trying to find the numbers but I'm pretty sure no Super Bowl winning team has ever had a negative ratio of sacks vs sacks taken.

I'd love to see anything you find.

I was also just browsing around the site "team rankings" - they have some tables related to sacks allowed and sacks made.

Offense:


Defense:

This data goes back to 2003.   

I probably won't be able to touch this again for a week.  The next 5 - 7 days are very busy ones for me.  But I'd really love to continue to analyze the importance of a good OLine to the overall success of a team.

If anyone can help look at data re: sacks allowed and wins for a few recent Superbowl winners, or some teams that have had big swings in fortune within the space of a few years, that would be interesting...  Obviously there are a lot of factors that create a winning season.  Some tangible and quantifiable, but many others intangible.

Link to comment
Share on other sites

Archived

This topic is now archived and is closed to further replies.


  • PMH4OWPW7JD2TDGWZKTOYL2T3E.jpg

  • Topics

  • Posts

    • Maybe a bit of a homer take but I can't give us a grade lower than A.   Freeling was arguably the best LT prospect in the draft.  His athletic ability is off the chart and at 6'7" that can move.  It was a no brainer pick.   Hunter's key word is Violence. Putting him next to Brown should scare an offensive coordinator. These two give Scourton and Phillips plenty of chances to get one on one opportunities. Brazzell, another tall receiver with sprinter speed.  Our WR room is filled with tall talented WR.  Brazzell is going to give us a WR that can take to roof off the defense.  Basically Jimmy Horn with size. W. Lee III has a nickname of the Blanket. (heard this on the Beleav podcast with J. Stewart)  What a great name.  A great value in the 5th round. Hecht A strong, fast and extremely smart center. Many had him listed as the best center in the draft.  He's most likely a starter sooner than later. Wheatley A good safety in round 5.  Someone who could see playing time.   Kuwatch  I love this pick.  At minimum he will be a key piece on special teams and with some good coaching he'll see some packages where he'll play.  His down piece is he doesn't stay up in the running game.  Good coaching will fix this.  He reminds me a bit of A.J. Klein.   All these picks were great value.  I believe everyone of them were graded higher than the pick we took them.   Dan Morgan is IMO doing a great job turning this team into a good team with great depth.
    • Moton is a class act.  
    • Sure, that is possible. That’s what, an extra 55 yards a game on average and 7 more TDs? What if he’s just 15th?  I imagine they would extend him in that situation due to the belief that he’ll keep trending up. maybe a 3 year contract to prove he can be top 10? Sounds like a Tepper plan.
×
×
  • Create New...