Jump to content
  • Welcome!

    Register and log in easily with Twitter or Google accounts!

    Or simply create a new Huddle account. 

    Members receive fewer ads , access our dark theme, and the ability to join the discussion!


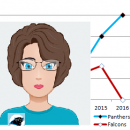
Riverboatin' in Carolina: The Panthers are on a tear in winning close games


KB_fan

Recommended Posts

I've got a new article up on the Huddle main page.

http://www.carolinahuddle.com/2016/07/15/carolina-panthers-close-games/

It takes a look at the Panthers history in close games, and most notably the five seasons under Head Coach Ron Rivera.  "Riverboat Ron" is alive and well, and the Panthers have been on quite a tear in winning close games in the 52 games they've played since Week 2 of the 2013 season when Riverboat was born...

Pre-Post Riverboat.png

Thanks to Sporting Charts, here's the Panthers Small Win-Loss differential for each season of their history.  We had the highest small win-loss differential ever in 2015, with 7 wins out of 8 games decided by 1 - 9 points.  (for a +6 Small W-L differential)

Small_W-L_differential.png


Here too is another graph from Sporting Charts that didn't make the article.  It compares Small Wins vs. Small Losses for each season.  Looking at 2011 - 2015 you can very clearly see the remarkable turnaround once Ron became Riverboat Ron:

Small Wins & Small Losses.png


And off-topic, but just for fun....  Here is the comparison of big wins and big losses ("big" = 10+ points)  over the years:

Big Wins & Big Losses.png


There's quite a bit more data in the article... so go check it out.

Link to comment
Share on other sites

21 minutes ago, Jeremy Igo said:

KBFan is a breathe of fresh air for any stats lovers looking for actual content from a writer.  

Thanks Jeremy.  It's a fun change of pace for me to write on a totally new subject this past year. 

Link to comment
Share on other sites

Great article.  Really love what Rivera has done to "right the ship."  Definitely intentional improvement.  I would love to compare all 32 teams' "small win" records over the years and see how we stack up.  Kinda hard determining relative reasons for success without a reference point.

Link to comment
Share on other sites

2 minutes ago, Dick the Butcher said:

Great article.  Really love what Rivera has done to "right the ship."  Definitely intentional improvement.  I would love to compare all 32 teams' "small win" records over the years and see how we stack up.  Kinda hard determining relative reasons for success without a reference point.

Actually, I was wondering the same thing, and have been looking at results for other teams.  I started to put some of that data into the article, but it upped the geek quotient so much I decided to leave it out for now.  After all, the Huddle isn't Football Outsiders or Football Perspective or a heavy-duty stats site like that.  But here in the forum, I'm happy to share some of what I've found.

Stay tuned.... I'll post more in a bit.,

Link to comment
Share on other sites

56 minutes ago, Your GFs favorite huddler said:

That Buffalo loss may have,under the radar, been one of the best things that's ever happened to this franchise. Those stats are mind blowing! Awesome work! It's really remarkable for a Coach to pull a 180 and do what Ron did and the facts are there to prove it! 

It's called believing in the guys YOU put on the field. Players love that on 4 and 1

Link to comment
Share on other sites

1 hour ago, KB_fan said:

I've got a new article up on the Huddle main page.

http://www.carolinahuddle.com/2016/07/15/carolina-panthers-close-games/

It takes a look at the Panthers history in close games, and most notably the five seasons under Head Coach Ron Rivera.  "Riverboat Ron" is alive and well, and the Panthers have been on quite a tear in winning close games in the 52 games they've played since Week 2 of the 2013 season when Riverboat was born...

Pre-Post Riverboat.png

Thanks to Sporting Charts, here's the Panthers Small Win-Loss differential for each season of their history.  We had the highest small win-loss differential ever in 2015, with 7 wins out of 8 games decided by 1 - 9 points.  (for a +6 Small W-L differential)

Small_W-L_differential.png


Here too is another graph from Sporting Charts that didn't make the article.  It compares Small Wins vs. Small Losses for each season.  Looking at 2011 - 2015 you can very clearly see the remarkable turnaround once Ron became Riverboat Ron:

Small Wins & Small Losses.png


And off-topic, but just for fun....  Here is the comparison of big wins and big losses ("big" = 10+ points)  over the years:

Big Wins & Big Losses.png


There's quite a bit more data in the article... so go check it out.

Can the Observer just hire you to replace Joe?  

Link to comment
Share on other sites

Using Sporting Charts, I was able to quite easily get data on big and small wins & losses for all teams from 2009 - 2015.  So, that's 32 teams and 7 seasons, for a total dataset covering 3584 games and 224 team seasons.   A good starting point!

There seems to be an INCREDIBLY, and perhaps surprisingly high, relationship between excellent performance in close games, and overall winning percentage.  In fact, I think I'd go as far as to say that with only rare exceptions you could quite probably use either close game win % or close game win-loss differential as a predictor of a season's success.

Here are the data for the 50 teams with the best close win % in the past 7 years (.667 of higher).  It happens to include the 2013, 2014, and 2015 Panthers:

top close win % teams 2009 - 2015.png

I know it's a lot of numbers, and I'll post some summary tables and averages in the following comments, but I want to point out a few things.

Look at the fairly high consistency in terms of numbers of close games played by teams each year.  The average is 8.  One would think that among some of the teams with the highest close win % you might find a number teams that only played 2 or 3 close games and happened to win 2 or 3.  In fact, of these 50 teams with the best close win records in the past 7 years, only the 2010 Seahawks and the 2009 Vikings played fewer than 5 close games.  Close games are a reality in the NFL.  You've got to win them to succeed.

Secondly, look at the overall win figures for this group of 50 teams.  Of these 50 teams with excellent records in winning close games, only 4 had a losing regular season record below .500, including the 2014 Panthers.  Winning close games correlates very clearly with a higher overall win %.

Link to comment
Share on other sites

Here are some averages for the full 7 year data set I examined re: close wins:

close game averages.png


The top line is pretty unexciting.  Those are the averages for all 224 team seasons in the 7 years of data I pulled from Sporting Charts.  Obviously small wins and overall wins average out over the entire league to .500, and a small W-L differential of 0.... Teams play an average of 8 close games per season, and average out to a 4-4 W-L record.


So... with that out of the way, look at the 2nd table (blue shading).  In that table, I grouped the teams by their overall win % and looked at their performance in winning close games.  You can see, there's not a big difference in close games played, though the very best teams tend to play 1 fewer close game per season (i.e. they have more big wins).  But there is a huge difference in close win %.  Good teams win close games.


The third table  (green shading) is perhaps the most interesting to me.  I grouped the 224 team seasons for these 7 years into 4 quartiles of 56 team results each based on the success in winning close games, and then looked at the averages, including the average overall win %.  

As expected, the teams with the best close win % had more wins.  

When all the data is graphed on an X-Y scatter plot, it gives a pretty linear relation:

Small W-L differential scatter plot.png

That's a REALLY quick & dirty graph and unfortunately since there are so many matching points, you can't really tell how common any particular value is.  I need to find a tool which would change the size of the points based on the number of values.  But quickly, the Small W-L is on the bottom, horizontal axis.  The number of total wins for a team with a given small W-L differential are plotted on the center vertical axis.

So to find the Panthers data for 2015:  go to the line for 6 on the horizontal axis, and then look up for the point at 15 wins. (interestingly enough, the 2011 GB Packers also had a 15-1 season, and a 6 Small W-L differential, identical to the 2015 Panthers).

I've got one more graph to post below.


Link to comment
Share on other sites

Here's perhaps a bit more useful data and a graph.

I created a histogram plotting the number of occurrences of each Small W-L differential level (the range was from - 8 to +8) in the 2009 - 2015 period.  That way you can see how frequent each level is.

Superimposed over that, I plotted the average number of total wins per team per season for teams that had that level of a Small W-L differential.

small W-L histogram.png

So you can see that the Panthers were one of only 3 teams from 2009 - 2015 with a +6 Small W-L differential, and that the average total wins for those teams was 14.   Our success in 2015, along with the 2011 Packers who also won 15 games while compiling a +6 Small W-L differential skews that number up quite sharply!!

Link to comment
Share on other sites

Archived

This topic is now archived and is closed to further replies.


  • PMH4OWPW7JD2TDGWZKTOYL2T3E.jpg

  • Topics

  • Posts

    • okay I found this and it sounds like my hopes for the first surgery being not such a great job seems like it could be actual reality.  I only hoped because that would give a better chance for recovery and ia a possible scenario so I just thought it could be possible. Had no real evidence of it. But I’ll be damned.    This is a detailed report of Brooks’ surgery and the condition of his knee after the failed repair.     https://x.com/jmthrivept/status/2055743129408704806?s= Sparked by some very good questions by @CoachspeakIndex, here’s some info on Jonathon Brooks: 1. Speculation that the first graft/ACLR by Dr. Cooper didn’t “take” or at least was too lax, leading to failure and re-tear. Brooks dealt with issues cutting, progressing in his rehab into the early stages of 2024 and then re-tore it late 2024, requiring a second ACLR in January 2025 (essentially revision). Notably, CAR prolonged Brooks’ rehab process through Sept-Oct due to issues progressing into the next stages of rehab. 2. Second surgery performed by Dr. Neal ElAttrache, who has extensive experience with revisions. He did a double bundle technique, harvesting graft from Brooks’ left patellar tendon and a strip of his right IT Band (his right patellar tendon had been utilized for the prior graft in 2023. The double bundle technique significantly increases rotational stability of the knee, leading to a stronger and more secure graft/reconstruction. Also to note, Brooks’ surgery wasn’t significantly delayed, meaning that the tunnels from his prior ACLR were in good shape and they didn’t need to perform bone grafts to fill in (would have delayed 2nd surgery by 5-6 months). Essentially, reading the tea leaves tells me that everything else except for the graft itself was still in good quality within his knee. Good sign for future.  3. Typically, you see a performance increase anywhere from 16-20 months post-revision. Brooks will be ~21 months out from his second surgery by the time Week 1 hits. His knee should be more stable and stronger this time around, with adequate time for healing and return to all movement patterns. I’m not viewing this situation as a typical “Player __ had TWO ACL tears, he’s cooked” situation. Rather, I’m viewing it as the first procedure failed, but the second procedure is significantly stronger and should allow him to return to form this time around. I don’t know why it posted as a link but there it is.  
    • Jackie, any more reps tomorrow, or is that it for this session?  thanks for the work
    • How can you say they aren’t trying to win now with all the moves made in free agency? Or is trading first round picks the only way to be win now? I’d be fine never trading another first round pick again, win now be damned.
×
×
  • Create New...